First Impressions of the AWS Graph Explorer
Published on January 9, 2023 — 4 min read
As a graph data enthusiast, I have a strong interest in graph visualization tools. Last weekend, I had an opportunity to play with the newly open-sourced AWS Graph Explorer. My first impression was that of great promise. The user interface was intuitive and easy to use, while the range of options and customization capabilities gave me a sense of the power of the tool.
Background
The Graph Explorer is a component of the Amazon Neptune graph database product to allow users browse graph-based data interactively without writing queries. It was open sourced by Amazon on Jan 3, 2023 (press release).
Deployment
It is straightforward to build and launch the Graph Explorer locally as a Docker container:
docker build --build-arg host=localhost -t graph-explorer .
docker run -p 5173:5173 -p 8182:8182 graph-explorer
Once the container was launched, I could open the Graph Explorer app at https://localhost:5173. Additionally, the container came with a proxy server on port 8182, which was needed when I connected to data sources without CORS header (e.g. Wikidata).
Data Connectivity
Since I primarily use RDF, my interest is in exploring the connectivity with RDF triple stores through the SPARQL 1.1 protocol. By default, the Graph Explorer appends /graph to a data source URL and uses the GET method to issue SPARQL queries. This is a little limiting and I wish more configuration flexibility for request/response handling will be supported soon.
Upon connecting to a data source, the Graph Explorer will fetch all the distinct classes and then attempt to retrieve all the predicate information for each class. The latter step led to a large number of simultaneous requests depending on the graph size/structure and in my experience easily overwhelmed many public SPARQL endpoints. This could potentially be mitigated via pagination.
# Fetch all the distinct classes
SELECT ?class  (COUNT(?start) AS ?instancesCount) {
  ?start a ?class
}
GROUP BY ?class

# Retrieve predicates for each class
SELECT DISTINCT ?pred (SAMPLE(?object) as ?sample) {
    ?subject a     <http://prokino.uga.edu/prokino#GeneExpression>;
              ?pred ?object.
    FILTER(!isBlank(?object) && isLiteral(?object))
}
GROUP BY ?pred
I had difficulty with the following data sources due to the limitations mentioned above:
| RDF Data Store | Reason |
|---|---|
| https://query.wikidata.org/ | Too many simultaneous requests during intialization |
| http://id.nlm.nih.gov/mesh/ | Too many simultaneous requests during intialization |
| https://data.nobelprize.org/ | Uses POST request |
| https://idsm.elixir-czech.cz/chemweb/ | Requires special request/response handling |
User Interface
Eventually I was able to connect to the public Protein Kinase Ontology database (http://vulcan.cs.uga.edu/), which has 7.31 M resources and 18.83 M predicates according to the Graph Explorer.
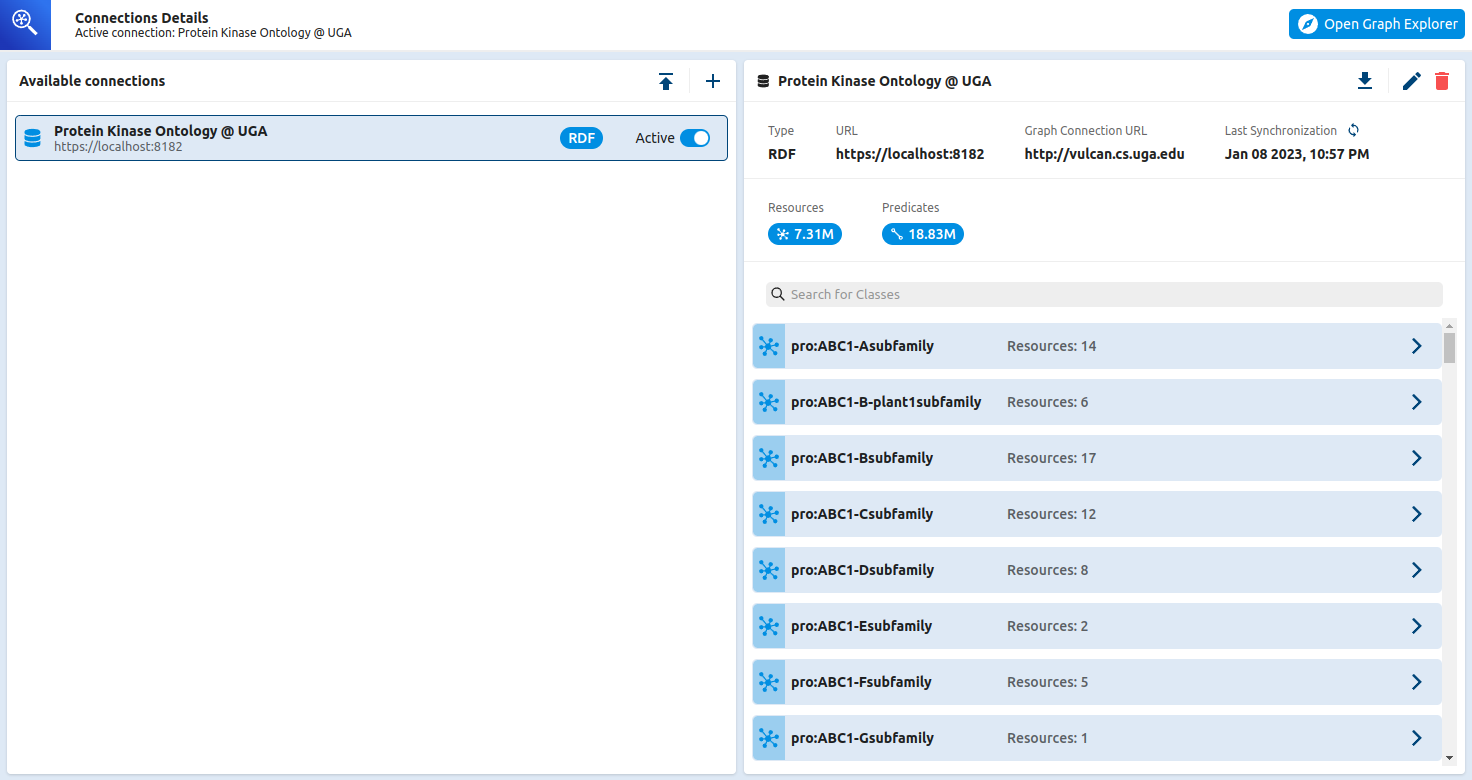
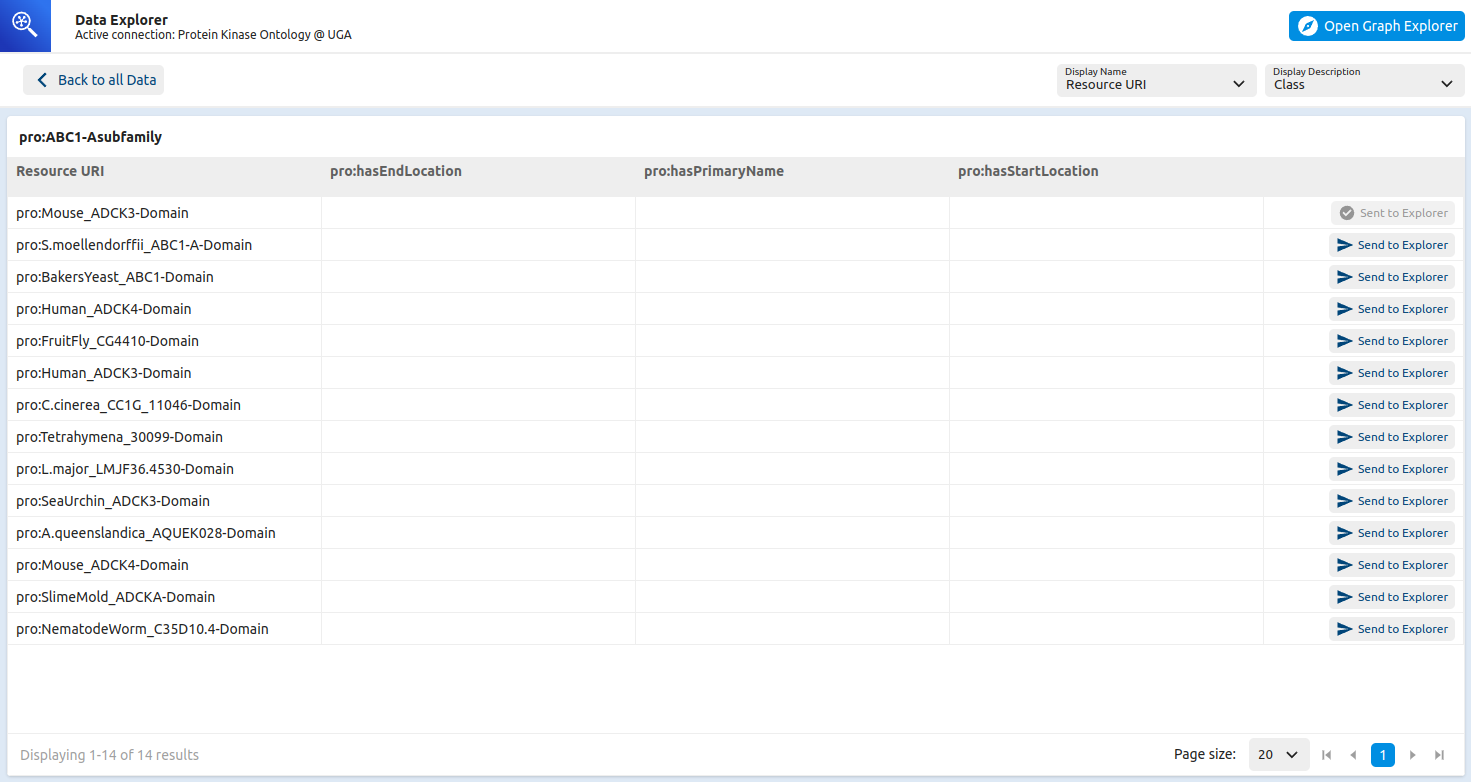
Once connected, I could pick any of the classes and then on the next page select resources to be added to the graph view.
The graph view is functionally rich and elegant. I could readily select any added resources and browse relevant details, all without writing a single SPARQL query!
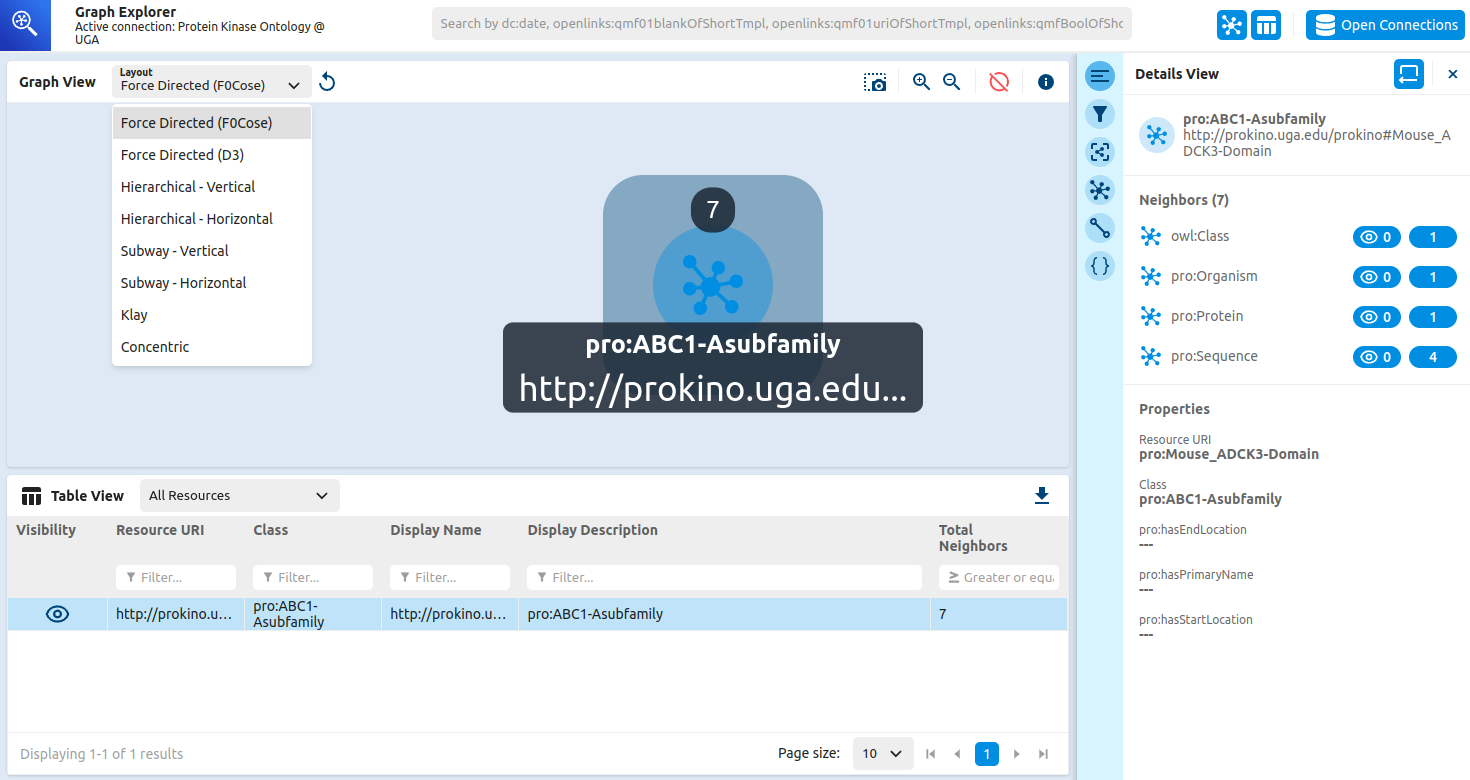
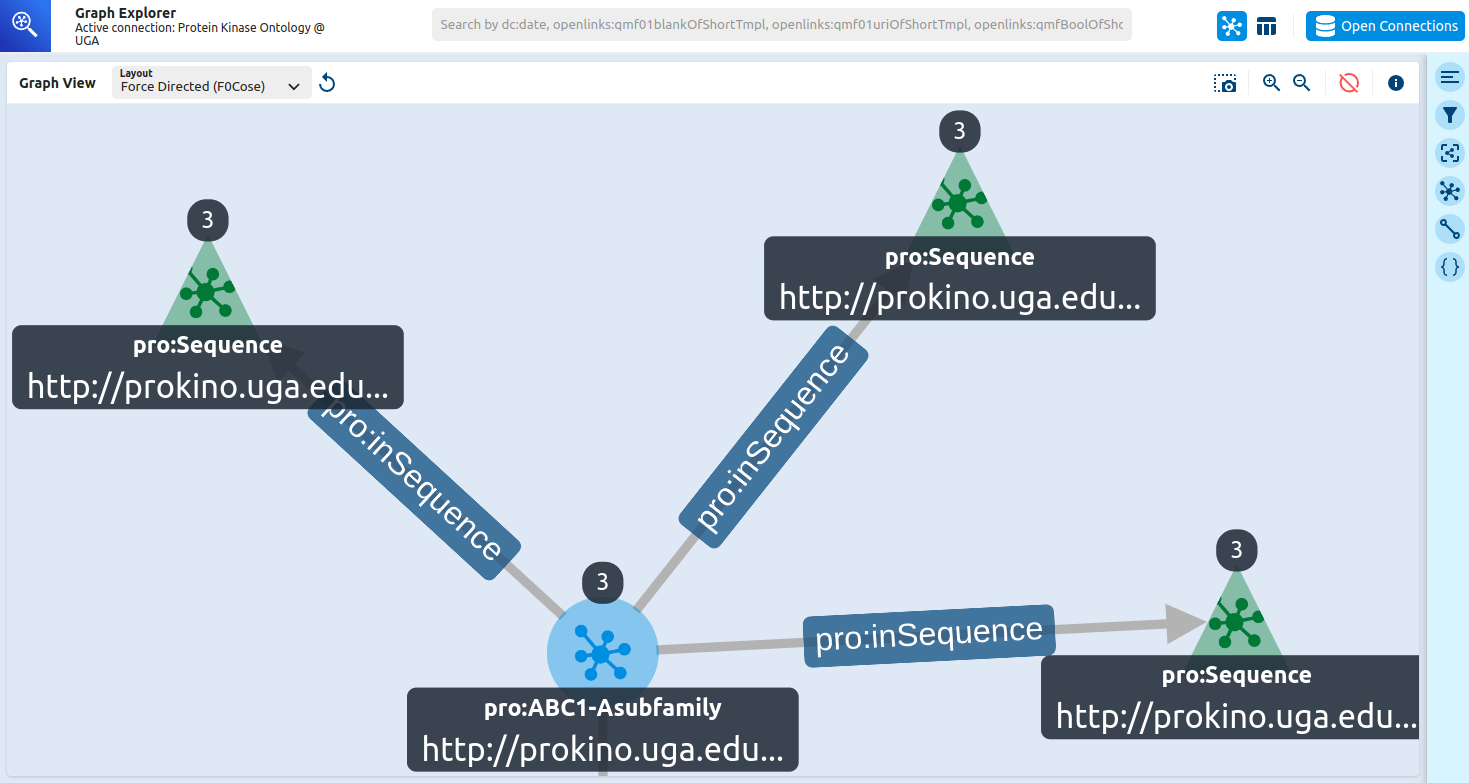
Like other graph visualization tools, I was able to select any node and expand the graph with ease. I could also customize the graph styles by class and predicate. The data behind the visualization could also be exported as CSV or JSON.
Components
Under the hood, the aws-graph-explorer is well modulated and leverages a range of other open-source libraries. Here is a quick summary:
Look & Feel
The tool uses the react-aria design system with custom styles using @emotion/css. For performance considerations, memoization and DOM virtualization are extensively used.
Data Connection
To support both Property Graph and RDF SPARQL, an AbstractConnector class is used to define a set of common graph queries (e.g. fetchNeighbors). The SparqlConnector then implements the abstract class through a set of SPARQL templates.
Visualization
The visualization component is based on cytoscope.js, which is perhaps the most well-known open-source JavaScript graph visualization library.
- SoftwareSPARQLData Visualization